Potential Costs
The current debate involves a variety of factors: historical value, environmental effects, and economic impacts. Since so many counties of the Park are economically distressed, much of the debate surrounds economic factors. Even the consideration of economic impact is multi-faceted, including both the effect on the tourism industry and the costs of executing the project. In this section we will discuss the potential costs of both projects using the statistics provided in the DEC's 2014 presentations.
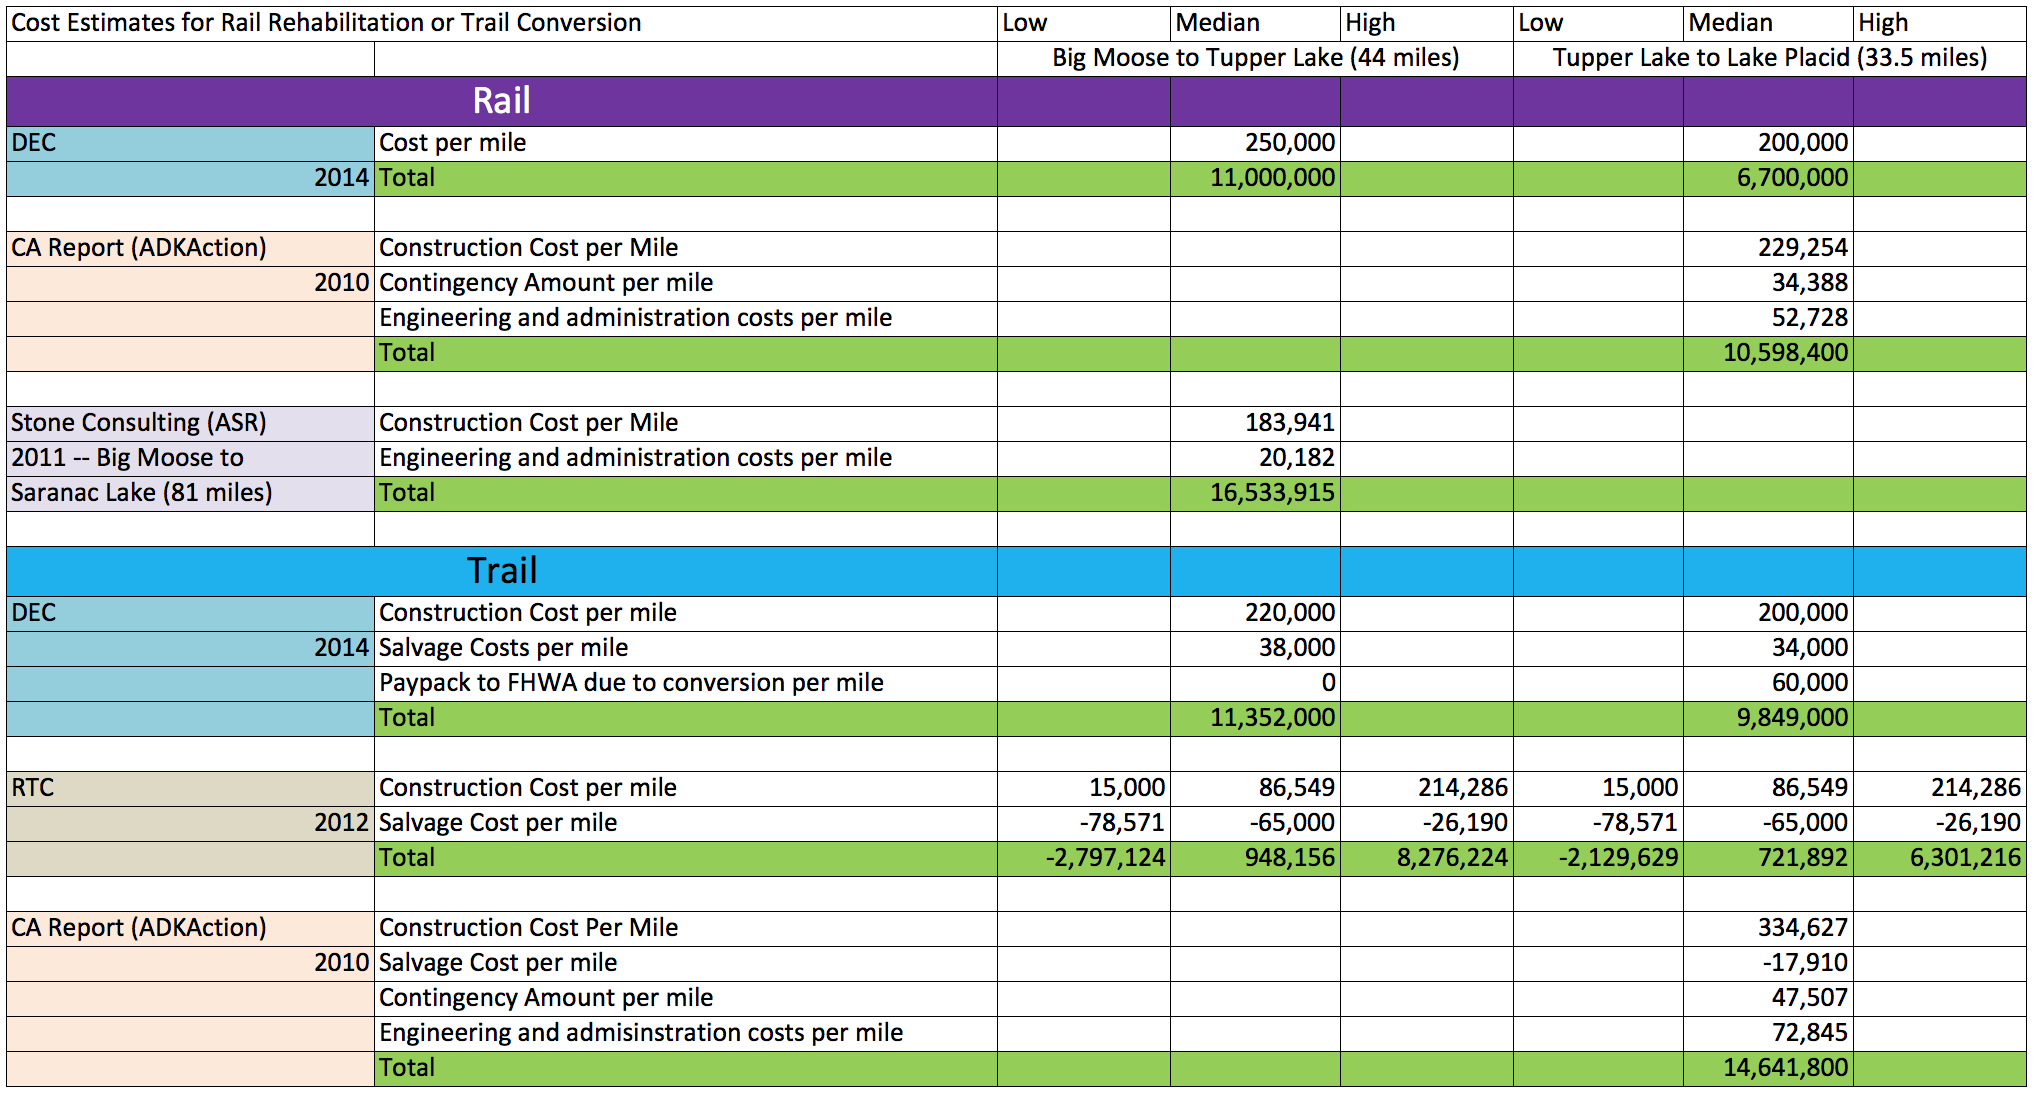
The DEC analyzes the costs by dividing the trail into two sections: Big Moose to Tupper Lake (44 miles) and Tupper Lake to Lake Placid (33.5 miles). According to their estimates, the total trail cost from Big Moose to Tupper Lake would amount to $11.4 million. This estimate takes net salvage value into consideration. Rail rehabilitation, on the other hand, would cost $11 million along the same stretch of the corridor. From Tupper Lake to Lake Placid, the DEC estimates that total trail cost would amount to $9.8 million and that rail rehabilitation would cost $6.7 million. The total costs along the entire corridor add to $21.2 million for trail construction and $17.7 million for rail rehabilitation. Thus, the DEC estimates that trail construction would cost $3.5 million more.
DOT determined these estimated costs using other recent track rehabilitation and trail construction projects. However, as DOT and the DEC admit, the costs for both projects largely depend on undecided factors. For instance, the level of track rehabilitation (how fast the trains will be able to travel) and the trail width and surface material will affect total costs. The DEC and DOT claim that long term maintenance costs would be similar for the railroad and the trail.
Several other reports, linked to in the "Economics" section, also estimated the costs for upgrading the different sections of the corridor. The values they predicted and some of the important factors that went into them deciding on their costs are listed in the chart below.